
Introduction
BuDS have produced 141 weekly Covid-19 risk assessments using data from the Office for National Statistics (ONS) Covid-19 Infection Survey. However, the Government have withdrawn funding for the Infection Survey, and the last weekly data was published on 24 March, covering the period up to 13 March.
BuDS have carried out an options appraisal on what to do now, and have decided to continue to publish a short weekly risk assessment using the best available Covid-19 data. We will also publish a monthly Covid-19 bulletin with full weekly deaths, hospitalisations, and vaccinations data.
This paper explains how BuDS have decided to use the Zoe Study as the basis for our weekly Covid-19 risk assessments from April 2023 onwards. It also explains the mathematical methodology we use and how we present the data.
Methodology
- We calculate the number of daily cases captured by the ONS Infection Survey1 in Bucks by applying the ONS prevalence for the South East (as a percentage) to the population of Bucks2. We call this the “ONS Total”.
- We calculate the number of daily cases captured by the Zoe study3 in Bucks by taking the total number of cases in the UK reported by the Zoe study, dividing by the UK population, then multiplying by the population of Bucks. We call this the “Zoe Total”. We do not use the Zoe study’s estimated cases in Bucks as we do not know the methodology behind this figure. We also think that applying the national prevalence is likely to be more accurate given the nature of the Zoe study.
- We compared the ONS Total with the Zoe Total between 1/11/21 and 13/3/23 (see graph)
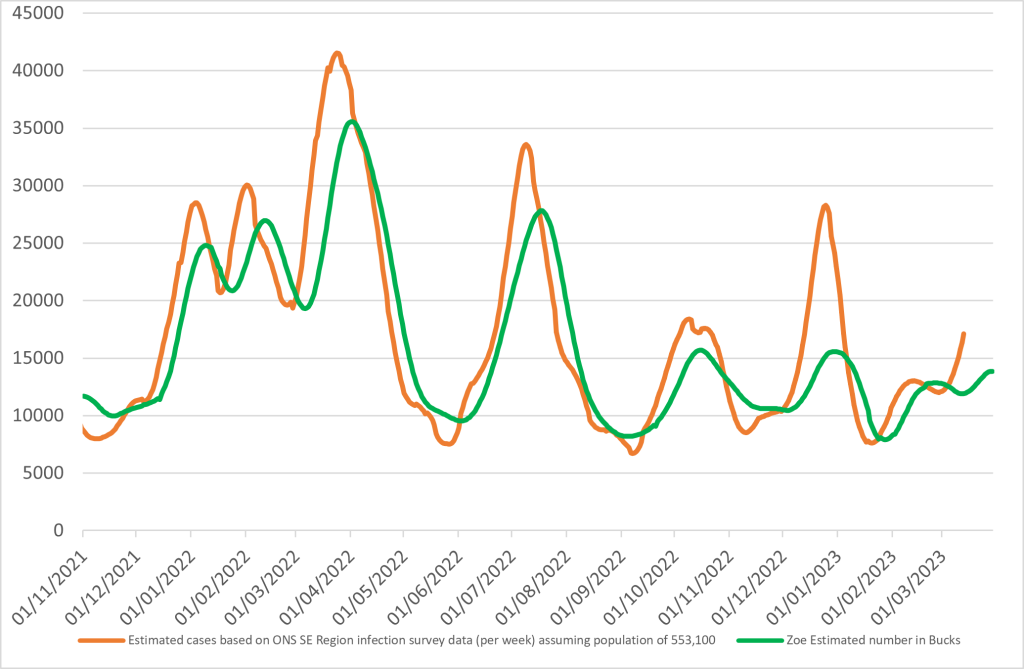
- From this graph, we have concluded the following:
- The Zoe Total lagged behind the ONS total by an average of 8 days. This is probably because the Zoe Study relies on people reporting their symptoms via the app, whereas the ONS Infection Survey tested people regardless of whether they had symptoms or not. As Covid-19 typically presents asymptomatically for around 7-10 days after infection, it follows that users of the Zoe app will report their infection around 7-10 days after they were in fact infected.
- Notwithstanding this reporting delay, the Zoe Total broadly follows the ONS Total between 1/11/21 and 1/12/22. However, it is notable that the Zoe Total was between 60% and 80% of the ONS Total during peaks of infection. This is probably because the Zoe Study was not demographically balanced in the same way as the ONS Infection Survey, meaning that a significant percentage of infections in people who were not users of the app were missed.
- From 1/12/22 to date, the relationship between the Zoe Total and the ONS Total changes. While the Zoe Total broadly follows the ONS Total during declines and troughs of infection, the Zoe Total is only 55% of the ONS Total at the peak of the January 2023 wave, and only 77% of the ONS Total over the duration of the January wave. A similar divergence can begin to be seen in the ONS Total and Zoe Total for the March 2023 wave. Speculatively, it may be that the demographics of the Zoe Study have become more unbalanced as the public, particularly younger people, lose interest in Covid.
- From 13/3/23, the ONS Total is no longer available, but the Zoe Total is still published. BuDS have considered how to best use the Zoe Total in the context of our weekly risk assessment for disabled and clinically vulnerable people. BuDS’ aim in the risk posts is to give disabled and clinically vulnerable people (D&CVP) a reasonably accurate idea of the risk of meeting an infected person in their everyday life. We are not seeking exact mathematical calculations, but information which fairly and honestly represents the risk facing D&CVP.
- BuDS has therefore decided the following:
- When the Zoe Total is in decline or plateauing from a decline (a trough), the Zoe Total will be used as the basis for the risk assessment.
- When the Zoe Total is rising or plateauing from a rise (a peak), three totals will be used as the basis for the risk assessment:
- These numbers will be presented in the context of the existing BuDS Covid-19 Risk Levels system, i.e. Very Low to Critically High. The focus of the risk assessment will be on helping D&CVP understand their current risk, avoiding unnecessary complexity. However, the risk assessments will include a link to a website article explaining in detail how the totals have been calculated.
- Other available data, such as ONS and UKHSA Covid death totals, NHS hospitalisation and vaccination statistics, and UKHSA test data, will be published in a new monthly Covid Bulletin, rather than in the weekly risk assessment. However, where this data provides helpful insights into Covid prevalence (for example, if hospitalisations start to increase sharply), then these insights will be included in the weekly risk assessment.
- A new weekly Covid risk graphic will accompany the weekly risk assessment article. The graphic will communicate the key messages in a simple, accessible way for all readers.
References & Method Explanations
[1] Coronavirus (COVID-19) Infection Survey, UK – Office for National Statistics
[2] 553100, from ONS Census data
[3] Latest Daily UK COVID-19 Data: Vaccines, Cases, Trends | ZOE (joinzoe.com)
[4] As calculated at peak of most recent wave (Dec 22 to Jan 23), where Zoe estimate was 55% of the calculated ONS incidence
[5] As calculated in period of most recent wave (Dec 22 to Jan 23), where Zoe estimate was, when averaged across the whole period of the wave (10/12/22 to 10/01/23), 77% of the ONS incidence at the peak